Produced by Charles Wells     Revised 2017-03-26
Introduction to this website    website TOC    website index   blog
If I see a derivative, I run the other way. --Warren Buffett
This is a new version of the Derivatives chapter. Every part of abstractmath.org is in a beta version, but as of March, 2017, this chapter is a particularly rough beta which I will improve over time.
This section of abstractmath.org is devoted solely to understanding the concept of derivative by showing you graphs of curves and their derivatives. I do not go into how you get the epsilon-definition which is necessary for producing the formulas you learn in calculus class for calculating the derivative.
The way to use this section is to stare at them to see how the function and its derivatives are related to each other. (See About the graphs.) You don’t have to know the formula for the derivative to understand these relations. Of course, you need the formula if you are going to use the derivative.
One of the values of putting things on the web is that I can include many more examples than would be practical to put in a book.
The file Derivatives.nb contains the source code that generated the illustrations in this article.
A continuous function $f$ may have a derivative, which is another function $f'$. Thus taking the derivative maps functions to functions. Such mappings are examples of operators.
Definition: For each real number $a$ where $f$ is defined, the derivative $f'(a)$ is the slope of the tangent line at the point $(a,f(a))$ on the curve.
Of course, the curve $y=f(x)$ may not have a tangent line at $(a,f(a))$ (for example, the absolute value function does not have a tangent at $(0,0)$). In that case the value $f'(a)$ is undefined.
This is a conceptual definition of “derivative”. The “conceptual definition” isn’t a mathematical definition until you define what "tangent line" means. If you work out all the definitions concerned, you get an epsilon-delta definition of derivative that often allows you to prove statements about them. This is illustrated in more detail in Concept and Computation and in The Power of Being Naive.
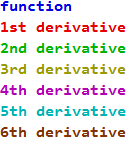
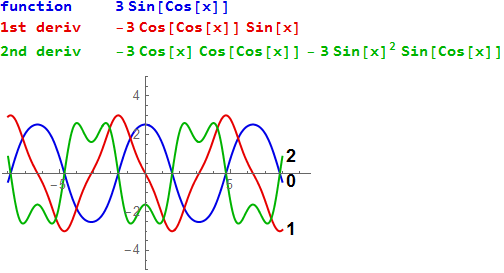
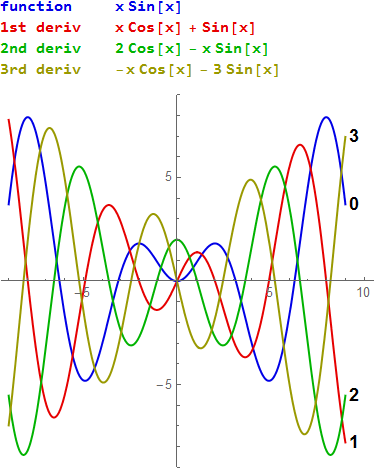
The derivatives are shown in each graph by color.

To help people who are color blind, the curves are also labeled "0" (the function), "1" (the first derivative), "2" (the second derivative) and so on.
Find evidence in each picture (not using the formulas!) that the various colored curves have the relationship to each other that the colors claim.
The point is for you to gain a solid intuitive understanding of the relationship of the derivative to the function just from the graphs.
Don't underestimate baby examples. Looking at a picture of one solidifies your understanding of what I have written above.
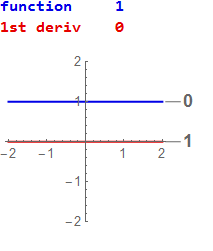
The tangent line to the straight line $y = 1$ is itself.
The derivative is the constant function $y= 0$ because the straight line $y = 1$ has slope $0$. You need to know only the definition of derivative to know that. You don't need to know any "formula".
This is the graph of the constant function $y=1$ and its derivative.
The identity function $y=x$ has slope $1$ at every point. So the first derivative will be the constant function $y= 1$ and the second derivative will be $y= 0$. Note that the second derivative of any nonvertical straight line is the constant zero function.

It has the same slope as the identity function so it has the same first and second derivatives.

This has a different slope.

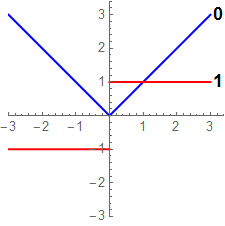
This is the function \[f(x)=\begin{cases} 0& \text{ if } x=0\\ -x & \text{ if } x\lt0\\ x & \text{ if } x\gt0\end {cases}\]
The point $(0,0)$ is on the graph of the absolute value function. Neither the point $(0,1)$ nor $(0,-1)$ is on the graph of the first derivative because there's no tangent line at $(0, 0)$. The graph of the absolute value function has a corner there.
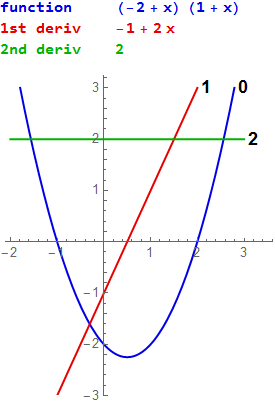
This function has one local minimum. The picture fits with the facts that the first derivative is $0$ at the squaring function's minimum, and the second derivative is positive there (not to mention everywhere else). You don't need to know the formulas for the function and its derivatives.


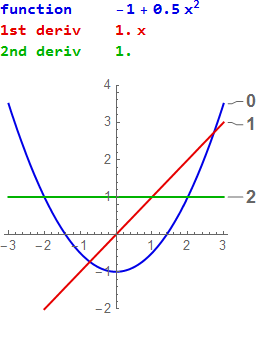
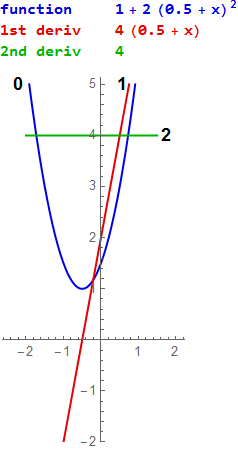
This function has no local maxima or minima because the first derivative has only one zero and the second derivative tells you that the function has an inflection point there. The function has only that one inflection point. You can't deduce this from the (blue) graph of the function because it might have an inflection point at minus a million or something. But you can deduce it from the second derivative, which has only one zero.
The function has exactly one zero, at $x=0$. You can't tell that it only has one zero just by looking at the graph, but you can tell there is only one using the formula, because $x^3$ is positive for $x\gt0$ and negative for $x\lt0$. You can't always trust graphs.
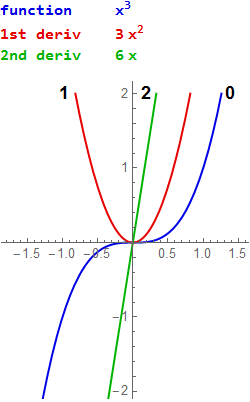
This function has no maxima or minima or critical points. It has one inflection point. Its roots are $0$, $i$ and $-i$.
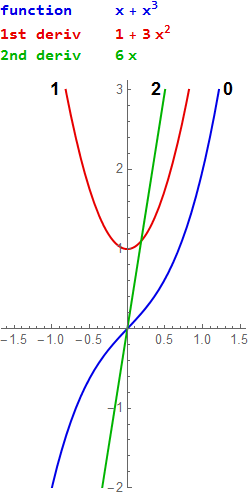
This function has two real roots, one of multiplicity two, and a local maximum and minimum.
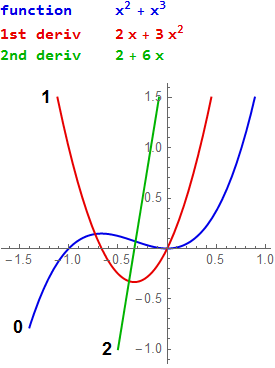
This function has one real root, a local maximum and a local minimum.
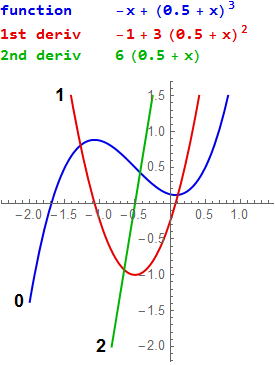
This function has local maxima and minima and three real roots.
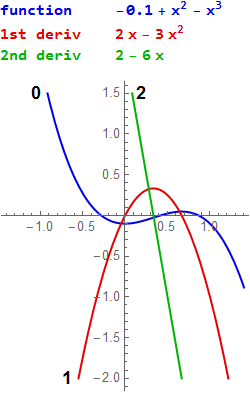
This function factors as $x(x^2+x+1)$. It has no local maxima or minima and three distinct roots, two of them complex.
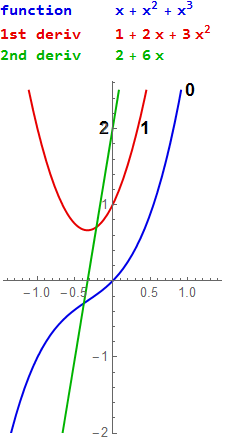
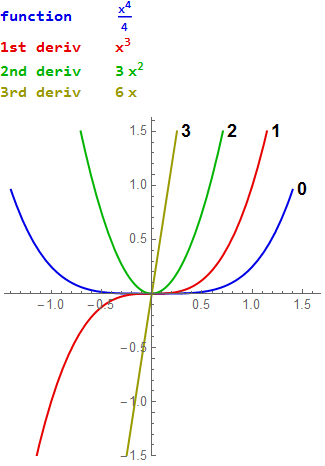
I scaled it by $\frac{1}{4}$ because it is hard to see the third derivative for $x\mapsto x^4$. This function has one quadruple zero at $(0,0)$ and it is extremely flat there. Note that the value at $0.3$ is just $0.002025$. Each of the three derivatives shown has just one zero, at $0$, which makes it hard for the function to get off the ground near $0$, so to speak.
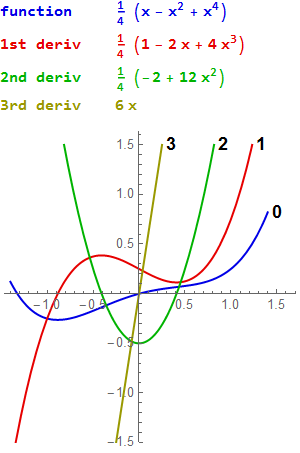
This function has two real roots and two complex roots. It has to have at least two since it factors as $x$ times a cubic, and a cubic always has a real root. It has a local minimum but no local maximum. That is sort of clear from the graph but the fact that the first derivative has only one zero proves that the function has only one local extremum. The function has two just barely visible inflection points where you see two zeros of the second derivative.
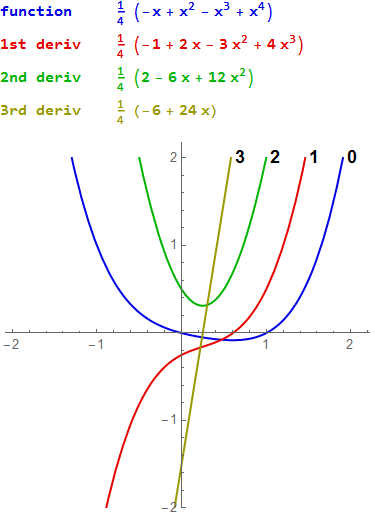
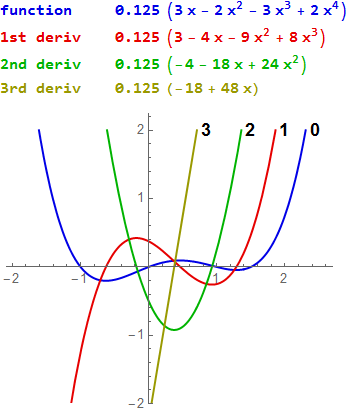
These derivatives make a very nice pattern that is worth enjoying for 15 minutes or so. All the formulas, for the function and its derivatives, have been simplified by collecting terms.
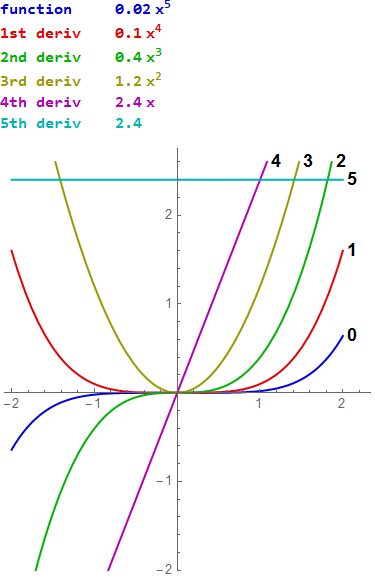
This is $x^5$, flattened to separate the derivatives. Compare this with the graphs of $y=x^2$, $y=x^3$, and $y=.25x^4$.
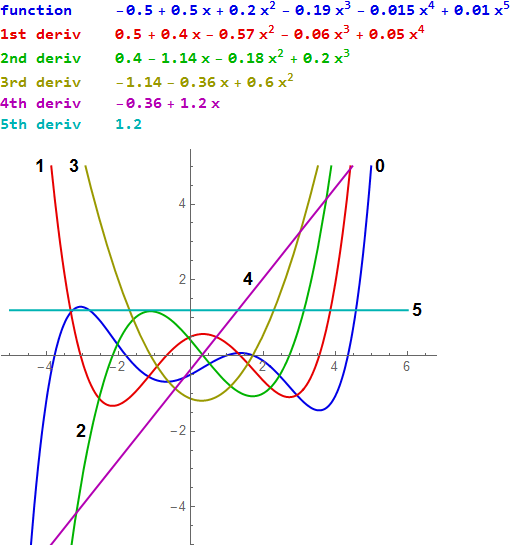
I fiddled with this polynomial until I got the function and all four derivatives to be separated from each other. All the roots of the function and all its derivatives are real and all are shown. Isn't it gorgeous?
Note: This document is written by a mathematician, so a number like $0.015$ means exactly $0.015$, in other words $\frac{15}{1000}$, which is $\frac{3}{200}$. If you have a scientific background, you might want to treat $0.015$ as an approximation or as an estimate, but that is not what is meant here.
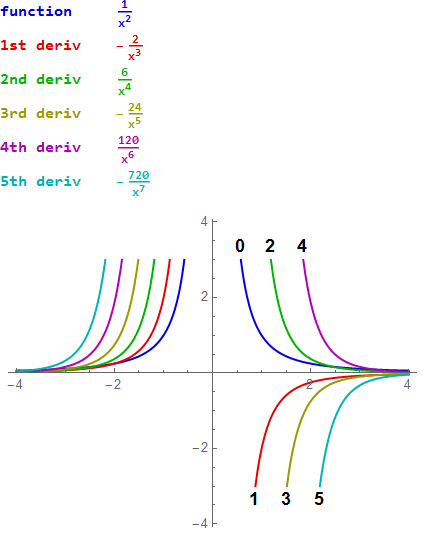
This curve has an asymptote at $y=0$. Notice the way the curves are evenly spaced.
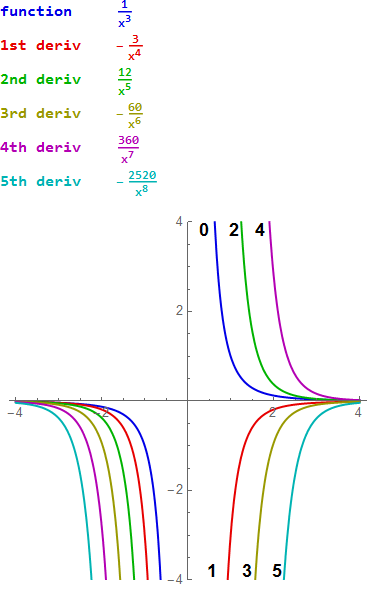
TO DO: The curves to the left of the $y$-axis should be labeled 5, 4, 3, 2, 1, 0 from left to right.
This function (and its derivatives) has an asymptote at $y=-1$.
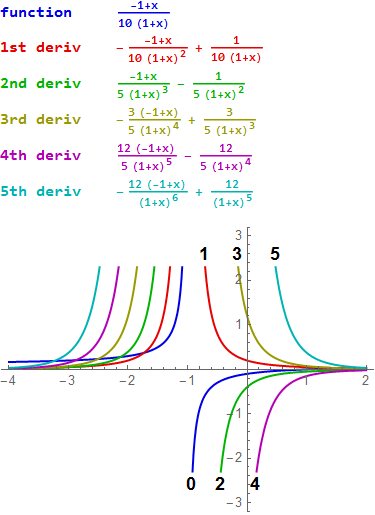
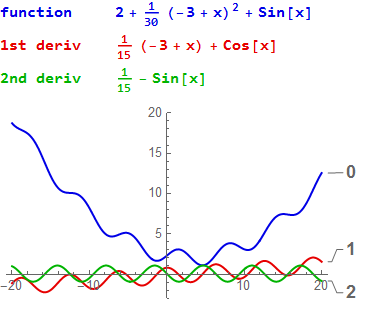
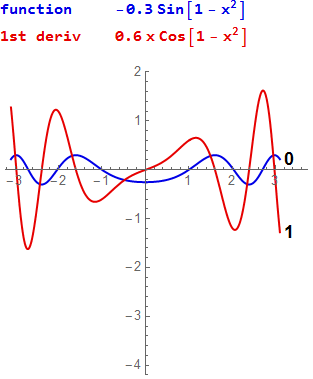
This function (and even more the next one) have a nice flowing graph but wiggly first and second derivatives. Analyze how this works out.
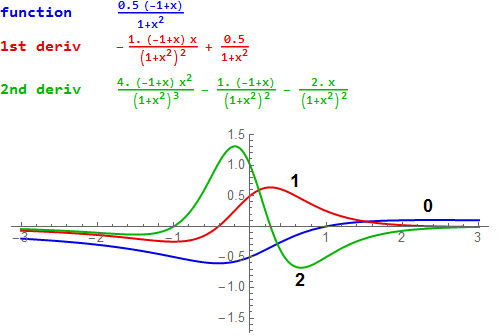
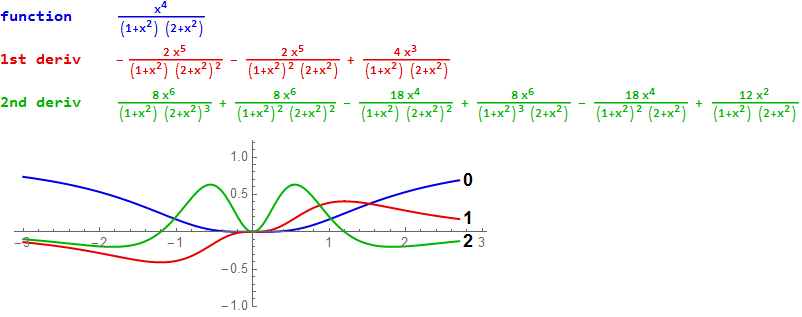
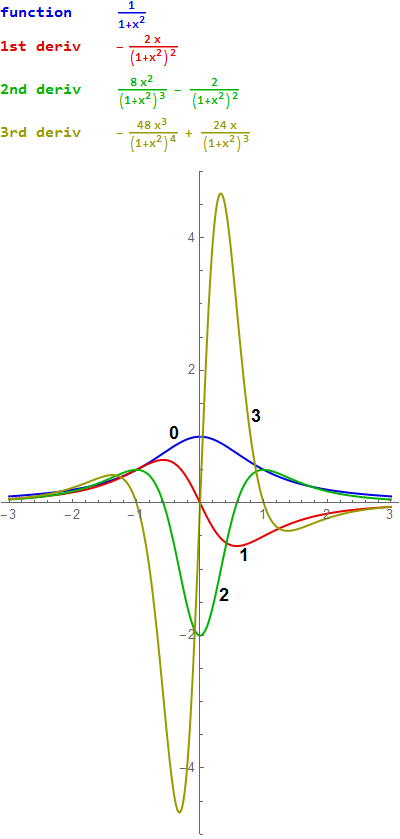
Compare the arctangent function.
Notice how very similar the graphs of the square root and the cube root are.
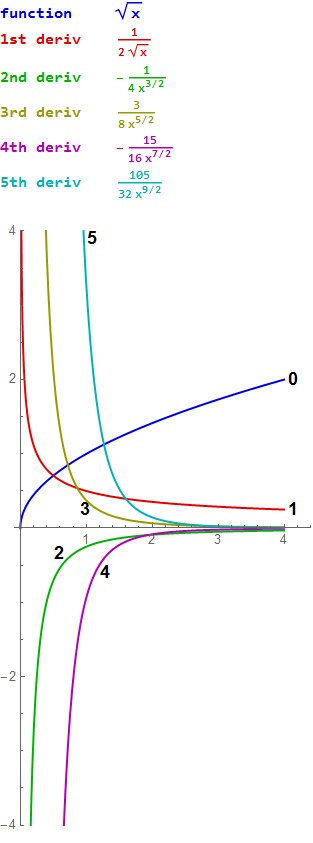
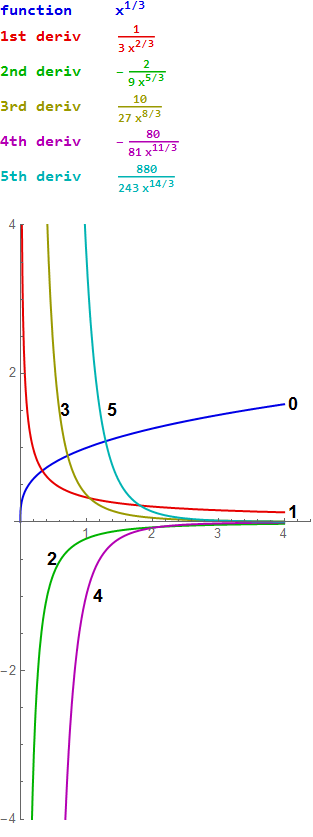
This is positively baroque.
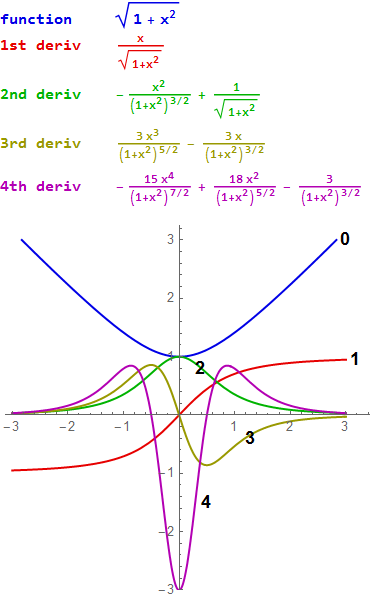
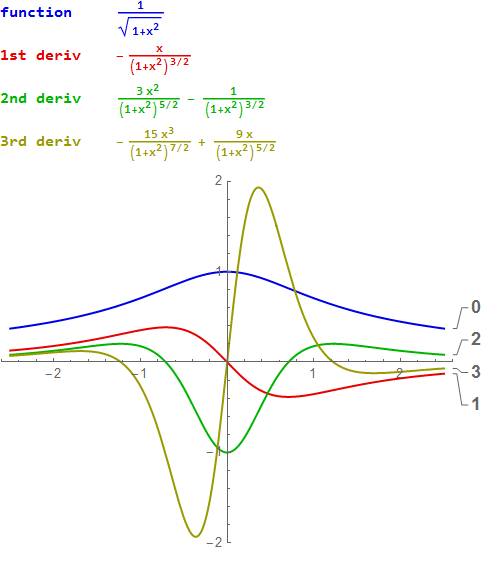
The sine function is its own fourth derivative.

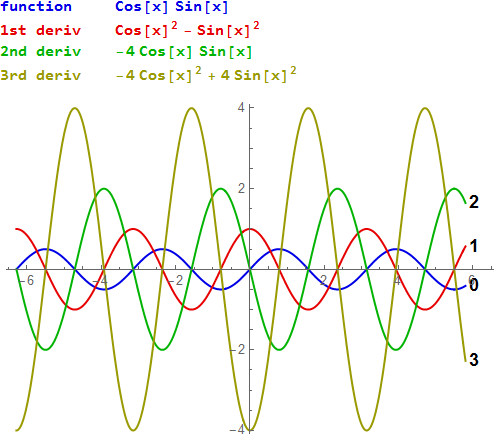
This is also its own fourth derivative. Be sure you understand the difference between this graph and the one for the sine function.
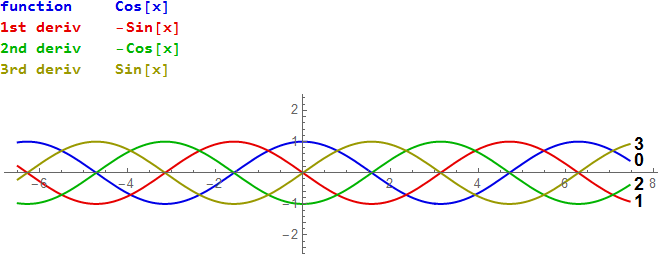
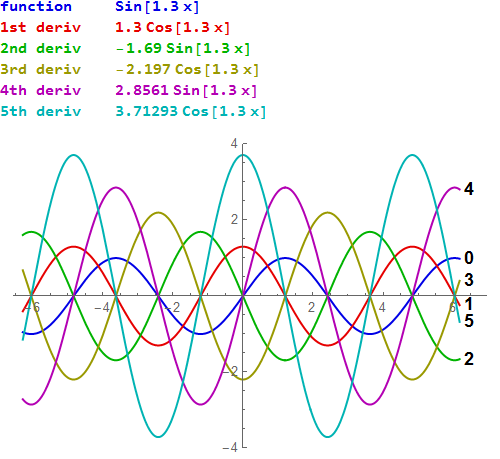
This is also it own fourth derivative. (Why is that not a surprise?) How tall are the waves?
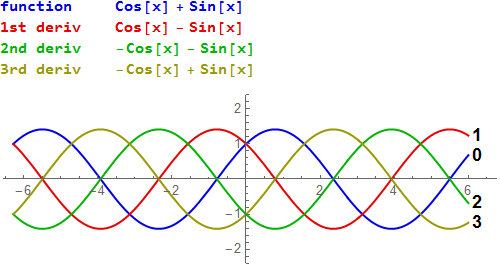
Each derivative is slightly taller. So this function is not its own fourth derivative.
Since $\tan x$ and $\sec x$ both have $\cos x$ in their denominators, and since $\cos\frac{\pi}{2}=0$, the function and all its derivatives, which contain $\tan$ or $\sec$ or both, have asymptotes at odd multiples of $\frac{\pi}{2}$. The graph shows four of the asymptotes (dashed vertical lines).
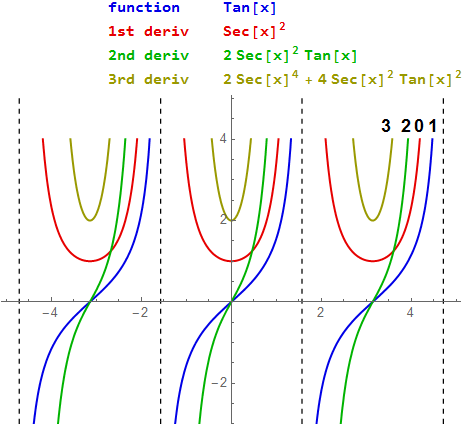
The vertical lines are asymptotes. Study the similarities and differences between this graph and that of $\tan x$.
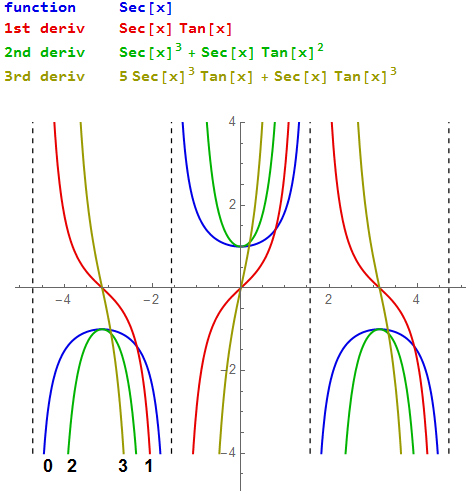
The function has two horizontal asymptotes. What are they?

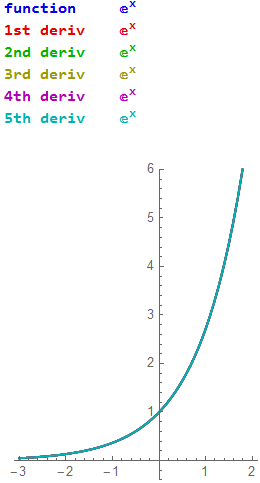
This is "the" exponential function. It is its own derivative. So in the picture below you see only one curve. The function and its derivative are all on top of each other.
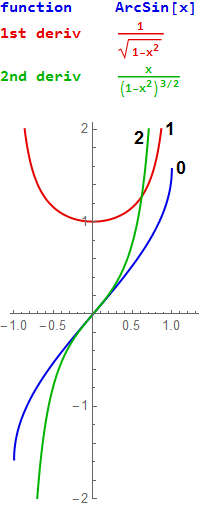
This function spreads its derivatives out like a peacock's tail so you can see all of them.
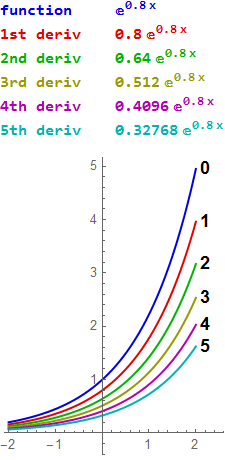
See if you can find evidence in the picture (not in the formulas) that the function is plausibly the derivative of its derivative.
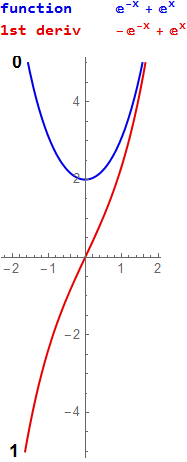
Here you should try to find evidence that the derivative of curve number 2 is curve number 0.
$y=0.3 \left(e^x+e^{-x/2} \cos \left(\dfrac{\sqrt{3} x}{2}\right)\right)$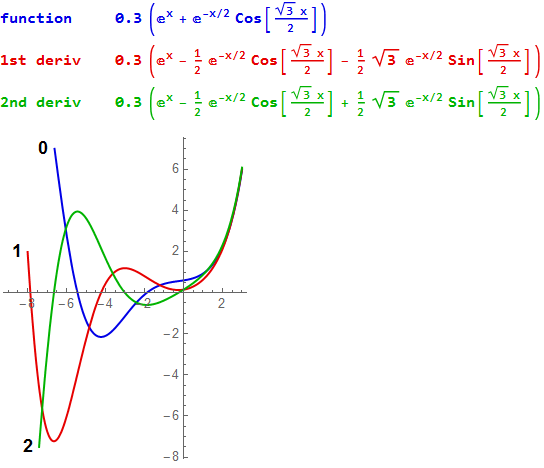
This is the natural log.

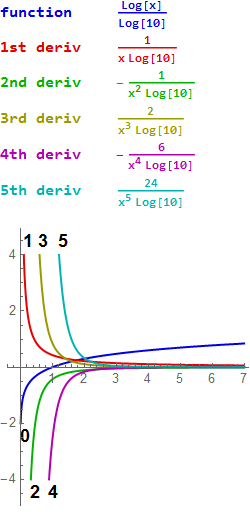
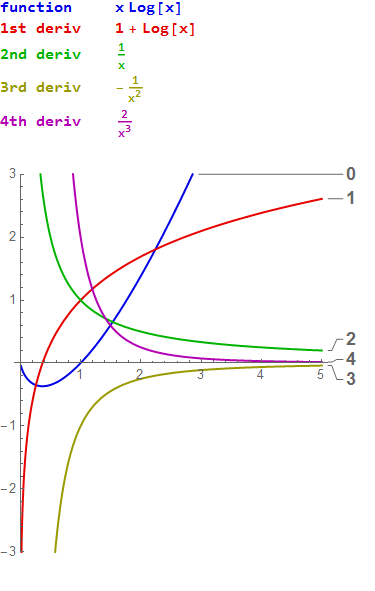
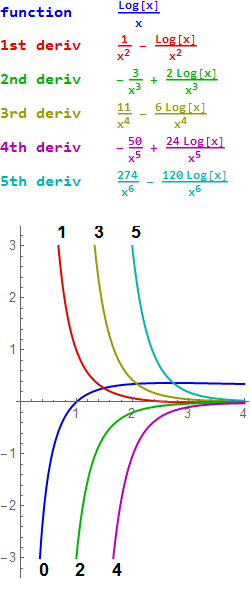
Note that the first derivative (red) is rising slowly.
This work is licensed under a Creative Commons Attribution-ShareAlike 2.5 License.